Highlights
Overall US growth trend slowing vs. company guidance
US High Yield Markets (JNK) vs. US 10-YR Treasuries (IEF)
China PPI deflationary?
Good Morning!
Recently, “the game” has slowed down. I can say this in two ways. The first, volatility in the 16-21 range is much less exciting than the 25-30 range. The SPX is struggling to close above the highs from February 2nd (2023), and the index has virtually moved sideways for approximately a year. Baseball moves faster at this point with the new pitch clock! All jokes aside, nothing says that volatility has to stay in this lower range, but that is what is happening for the moment. I felt the quote below captures this observation.
“Time does not run in a straight line, like the markings on a wooden ruler. It stretches and shrinks, as if the ruler were made of balloon rubber. This is true in daily life: We perk up during high drama, nod off when bored. Markets do the same.”- Benoit B. Mandelbrot, The (Mis)Behavior of Markets
Why do I reference February 2nd? As I learned from Keith McCullough (CEO of Hedgeye Risk Management) and Mandelbrot (author of The Misbehavior of Markets), it is the particular moments in time that matter. The month of January into early February was one of the most aggressive short coverings dating back over the last decade, which crescendoed into February 2nd. This was a manic period where junk credit and some of the worst pockets of the market went vertical for a couple of weeks. Recall two of those names, Bed Bath and Beyond and Silvergate Capital. Bed Bath filed for Bankruptcy. Silvergate is close to zero and has been de-listed. The chart below was provided by Keith McCullough, CEO of Hedgeye Risk Management (data provided by Goldman Sachs).
*Tweet Keith McCullough and Goldman Prime Brokerage Data
This particular point in time occurred only a few weeks before the Silicon Valley Collapse, which kicked off the current banking crisis. I Just find February 2nd as a very interesting point in cycle time, which the current S&P 500 market prices are failing to eclipse.
The second way that “the game” has slowed down has come from my ability and confidence to execute my process. Right or wrong, I am just doing what needs to be done at particular moments in time. The clarity has also resulted from scaling back my excess consumption of Twitter, financial media, and anything Daniel Kahneman would call “noise”. Over lunch this week, I had the opportunity to speak to Eric McArdle who works at Simplify Asset Management. From the jump, I could tell that Eric has a deep passion for playing the game. We shared a similar characteristic: the desire to learn something new daily. Additionally, we talked about the importance of evolving as it applies to a process within markets. There is no singular solution. Each individual has to pave their path and implement the best practices that work for themselves.
Macro
Going to briefly run through three thoughts that have been interesting to me throughout the week.
Overall US growth trend slowing vs. company guidance
US High Yield Markets (JNK) vs. US 10-YR Treasuries (IEF)
China PPI deflationary?
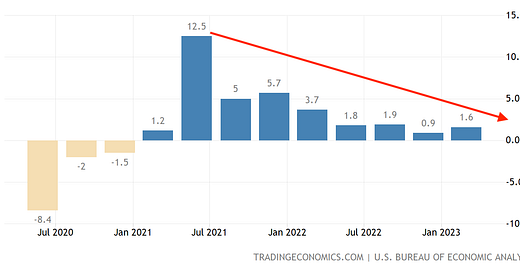
Should not be a secret that the overall growth trend for the US is slowing. Growth went from a peak of +12.5% in Q2 2021 to +1.8% in Q2 of 2022. On a quarterly basis, there have been a few minor re-acceleration along the way. An example would be +5.7% growth in Q4 2021 where the market indexes peaked in price.
The latest quarter (Q1 2023) printed +1.6% growth, which was higher than the +0.9% cycle low in the prior quarter (Q4 2022). However, this is well off peak +12.5% growth (Q2 2021) and +3.7% a year prior in Q1 2022. Will be interesting to find out whether this recent quarter acceleration is just another bum in the data set before following the longer-term trend lower once again. My view is that growth will continue to slow.
Mentioning this because I have heard some upbeat guidance and earning expectations from some management teams recently based on backward-looking numbers from a quarter in which there was a minor sequential growth acceleration. Some companies have been updating their guidance for more positive revenue and earnings numbers in Q2 of 2023. While some of them may be correct, I am skeptical of others. For many of these companies, the market has fully eaten from the hands of these management teams and blindly believed their guidance, which in some cases, helped to push their stock prices higher. The question in my mind is what happens to the earnings of these companies in an environment where GDP growth slows sequentially and year over year once again?
I find it funny that some of these companies are raising their expectations and guiding for higher revenues/earnings right before another potential deceleration in growth that follows the path of the longer-term trend. There are more factors as to why this can happen, but keeping it brief today.
US GDP Growth Y/Y
*Trading Economics GDP Year Over Year
*TradingEconomics GDP Year Over Year
Next, citing a potential divergence in US High-Yield Bonds (JNK) vs. US 10-Year Treasuries (IEF).
JNK vs. IEF
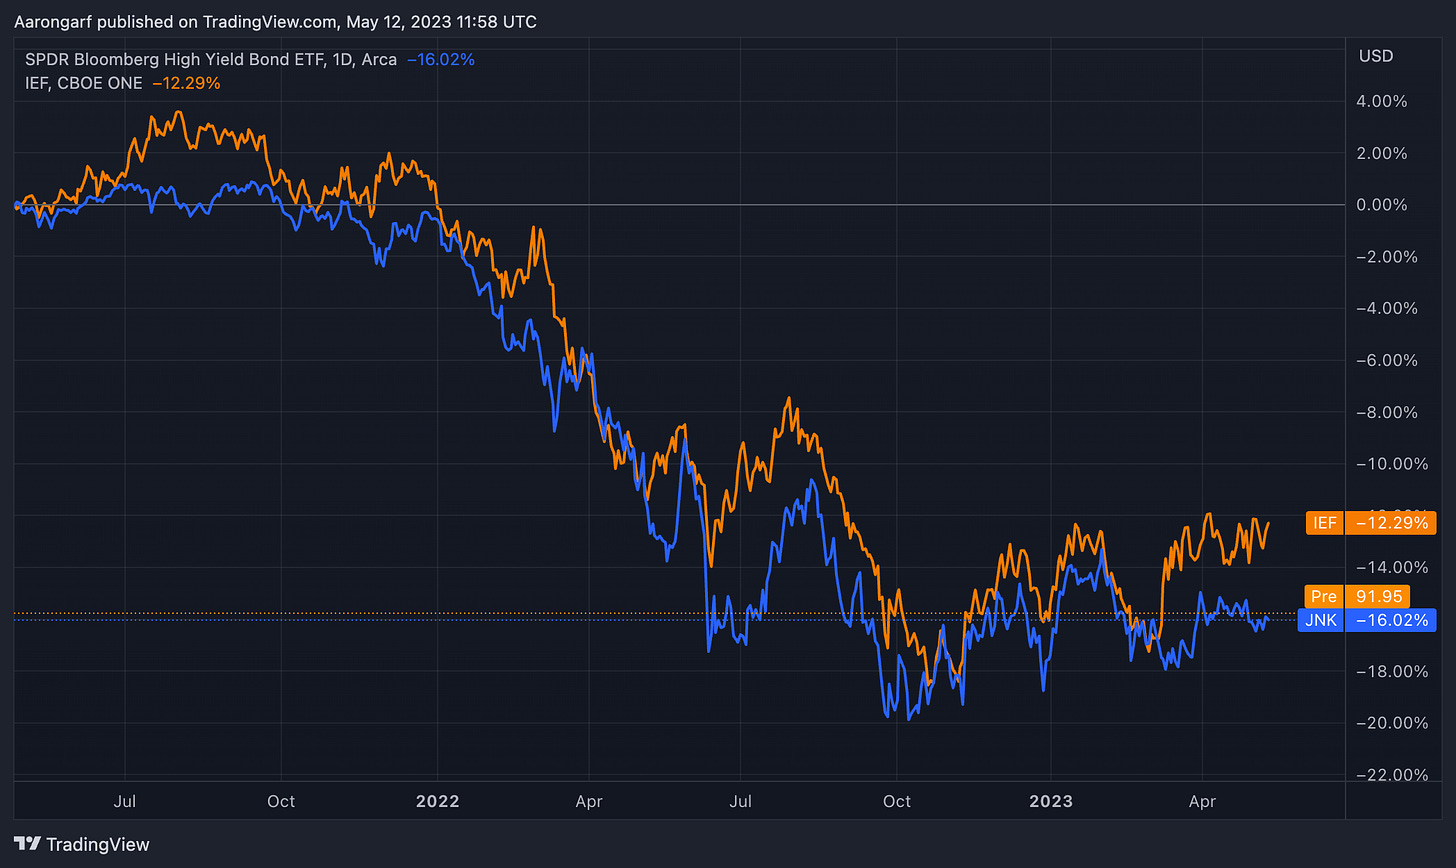
During periods of economic distress, quality bonds/ 10-YR Treasuries (IEF) generally will outperform Junk (JNK). In the chart above, IEF is represented by the orange line and JNK is represented by the blue line.
Throughout 2022, these assets were highly correlated and both fell in price during one of the worst bond sell-offs in modern history. There was one period of time where the correlation diverged and that was in late February of 2022, which was the Russian Invasion of Ukraine. There was a flight to safety (buying IEF) and selling risky credit (JNK). Following that event, the correlation continued into early 2023.
Monday, March 6th is where this correlation broke once again. This was the week were Silicon Valley Bank collapsed. IEF rallied and JNK sold off. While, it may still be early in this trend, so far, the IEF outperformance has remained intact. The spread between IEF and JNK is getting wider. As more banking issues persist and credit issues surface, this spread, divergence, and outperformance may continue to get wider, which has happened previously during periods of economic recession.
Lastly, I question the Deflationary economic trends in China. There was a large re-acceleration in growth in China following their termination of the restrictive Covid-19 policy. However, recent economic data suggests that there may potentially be other problems for the broader health of their economy. I will show charts of China's PPI and CPI for this analysis.
China PPI
*TradingEconomics
China CPI
*TradingEconomics
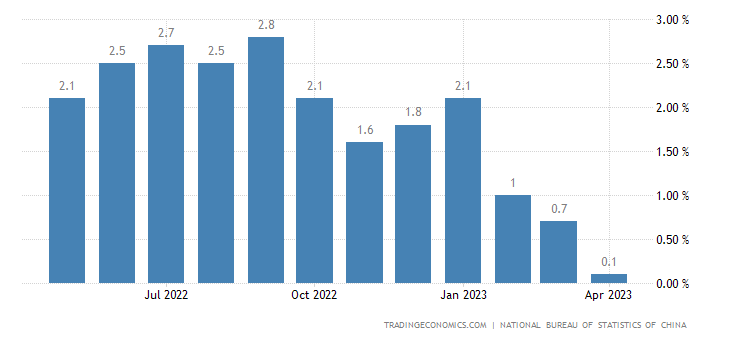
China's PPI made a new cycle low of -3.6% (April) vs. -2.5% (March). PPI is an abbreviation for the producer price index and this often leads the data of the CPI (Consumer Price Index). Despite the economic “re-opening”, China’s PPI is at negative levels not seen since the 2020 Covid lows. Negative PPI historically in China coincided with periods of recession notably 2002 and 2008.
In regards to CPI, the print was +0.1% (April) vs. +0.7% (March), which puts this metric on the verge of going negative, which is inherently deflationary. Looking at the charts above historically, there have been five other instances where PPI went negative. CPI went negative in four of those five events. Perhaps the economic problems are not over in China yet. Time will tell, but these data points made me think this week.
Conclusion
The particular points and time matter. February 2nd is high on the priority list in significance for many reasons, but the crescendo and peak short-capitulation may be two of them. I have talked about the nonchalant sideways motion of the markets previously. Well, this is still happening.
These are the three details that I found to be thought-provoking for me this week. I will still be thinking about them after writing this piece.
Overall US growth trend slowing vs. company guidance
US High Yield Markets (JNK) vs. US 10-YR Treasuries (IEF)
China PPI deflationary?
Entertaining to contemplate that when the “game” slows down, there are probably many people falling asleep at the wheel.
Happy Friday,
Aaron David Garfinkel
Resources
Keith McCullough, CEO Hegdeye Risk Management
Reference to Goldman Prime Brokerage data here
Benoit B. Mandelbrot, Author, “The (Mis)Behavior of Markets”
Link to his book here
Daniel Kahneman
Trading Economics
GDP Charts here
China PPI here
China CPI here


As always very insightful.