Highlights
Robust consumption on credit→ Higher rates→ Accelerating delinquencies→ Higher credit constraints→ Additional credit for spend unavailable→ Lower propensity to spend in the future.
Capital One and Discover Financial’s consumer credit metrics have been accelerating in a negative direction and are reaching levels that have historically preceded negative economic environments.
Credit metrics continue to deteriorate, however, this relationship continues to be misrepresented by high yield spreads, which compressed over the past two weeks as the credit risks accelerated over the last month.
Happy Thanksgiving!
I want to express my gratitude to family, friends, readers, and all of those people that make the world go round. Sending the best wishes to everyone’s families!
Thanks for taking the time to read my thoughts. As always, my goal is to be informative, help others learn, and time written work appropriately when possible. I am not going to be 100% perfect all of the time, such as last week’s whiff on CPI (“just a bit outside”), but those misses are all opportunities to learn. over the next week, I encourage readers to reflect on positive ways to grow and learn from previous mistakes. Please spend and appreciate time with family because it will be meaningful.
Today’s discussion is centered around the consumer. This year positive economic growth has been a large beneficiary of a continued increase in consumer spending. Below will be a dive into credit data, and these metrics will show why high-yield spreads continue to be understated by the market. The riskiest debt and influential factors are not being taken seriously. If payments on credit cards are not being made, then what else is not being paid?
Macro
For the context of this discussion, it is critical to understand net charge-offs (C/O) and 30-day delinquencies (30-Day).
30-Day Delinquency: When a credit holder is behind on their required monthly payments by at least 30 days. This can be indicative of the end consumer paying late or not paying at all.
Net Charge-Offs: This is the amount of debt that a company is reporting as uncollectible, and can be comprised of delinquent or bad debt. Net Charge-Offs measure debt that is unlikely to be paid back.
Why are these concepts important? Consumer spending comprises approximately 66% of GDP, so it is always important to monitor consumer conditions and the credit environment. The relationship is more intricate than demonstrated below, but here is a brief example.
Robust consumption on credit→ Higher rates→ Accelerating delinquencies→ Higher credit constraints→ Additional credit for spend unavailable→ Lower propensity to spend in the future.
Lower consumption on credit→ Lower rates→ Decelerating delinquencies→ Easing Credit conditions→ Credit more accessible→ Higher propensity to spend in the future.
Historically, accelerating 30-day delinquencies and Net Charge-Offs on a trending basis have coincided with periods of economic distress, and have served as leading indicators for the overall economy. These impact consumer behavior and their ability to continue spending on a go-forward basis. Additionally, financial counterparties are affected by non-performing loans. Both metrics are used to evaluate the quality and risk within a loan portfolio. This past week, Josh Steiner (Hedgeye Analyst), highlighted the following data points.
Capital One Financial Net Charge-Offs +5.08% (October 2023) vs. 2.93% (October 2022).
Capital One Financial 30-Day Delinquency +4.48% (October 2023) vs. 3.17% (October 2022).
Both key credit metrics continue to accelerate in the wrong direction year over year. I found these data points to be particularly interesting, so the following is a deeper analysis using both Capital One Financial and Discover Financial’s consumer credit metrics.
Capital One Financial Net Charge-Offs and 30-Day Delinquency
Both metrics have normalized following the artificially low levels that were a result of pandemic stimulus and moratorium laws. The trend is higher and October 2023 delinquencies are beginning to rival levels seen during October 2008 of +4.48%.
Additionally, if we are comparing to pre-pandemic credit levels October 2019 Net Charge-Offs were +3.95% and 30-Day Delinquencies were +3.79%. Current levels are higher. The chart below compares the averages of these metrics for different periods in “economic cycle time” to current conditions in October 2023.
A common theme from Q3 2023 bank and credit card company earnings was the discussion of the “normalization of credit trends”. I argue that for Capital One 30-Day Delinquencies, the data is past the point of normalization and is accelerating to the upside as highlighted in all of the charts shown above.
Discover Financial Net Charge-Offs and 30-Day Delinquency
I find it important to include data for multiple consumer card sources. Capital One Financial and Discover historically have a riskier loan profile and generally work with lower-income consumers. First, I understand that some readers may use their services, so please don’t cancel. Second, lower income brackets are usually the first to be adversely impacted by deteriorating economic conditions. Below is data from Discover Financial.
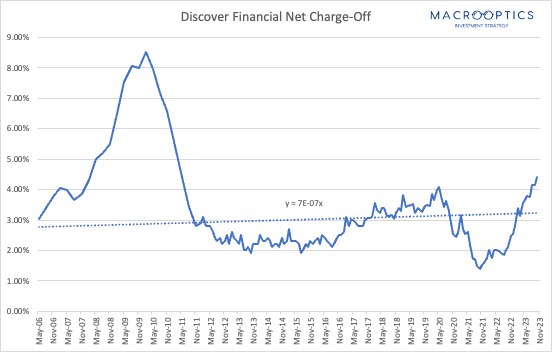
There is a clear acceleration for credit trends that are being reported from Discover Financial and both metrics are moving in the wrong direction.
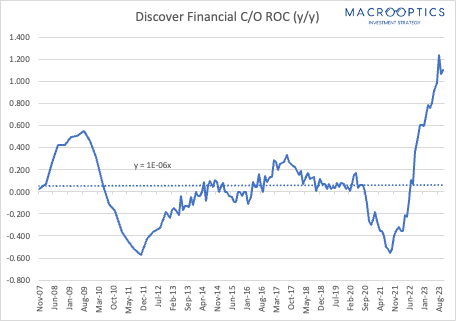
When viewing Discover Financial’s consumer credit conditions on a year-over-year basis for both metrics, the magnitude is alarming. While part of this acceleration has come from the normalization of the overall consumer credit environment, the pace has been more rapid than the GFC.
October’s data illustrates both 30-Day Delinquent and Net Charge-Offs moving one standard deviation outside of the historical mean (20 years of data). Not yet to the most extreme levels, but the trend is negatively accelerating past “normalization”.
October 2023 Delinquency is +3.61% vs. +2.61% in October of 2019.
October 2023 Net Charge-Offs is +4.42% vs. 3.27% in October of 2019.
These credit trends are similar to the acceleration that took place in November 2007 +3.58% (Delinquent) and +3.85% (Charge-Offs).
Following, in February of 2008 these same metrics were +3.90% (Delinquent) and +4.33% (Charge-Offs).
Conclusion
My view is that high-yield spreads continue to be understated for various reasons. One of which, is the consumer credit data that was discussed throughout this publication. The recent compression in high-yield spreads and the positive price appreciation from HYG (mainly rate-driven) present another great hedging opportunity for the long portfolio.
While we cannot conclude that because there are similarities within the data sets between October 2023 and the GFC that the same outcome as 2008/2009 will be guaranteed (A+B=GFC?), there should be caution given how the consumer credit data continues to trend. Remember, this is not just about making payments on credit cards. These metrics can be early indicators of the consumer’s ability to make rent payments, mortgage payments, student loan payments, buying necessities vs. buying discretionary items, luxury, and leisure. If payments on credit cards are not being made, then what else is not being paid?
Best of Luck,
Aaron David Garfinkel
Resources


Insightful commentary